A clearer picture of the passenger experience.
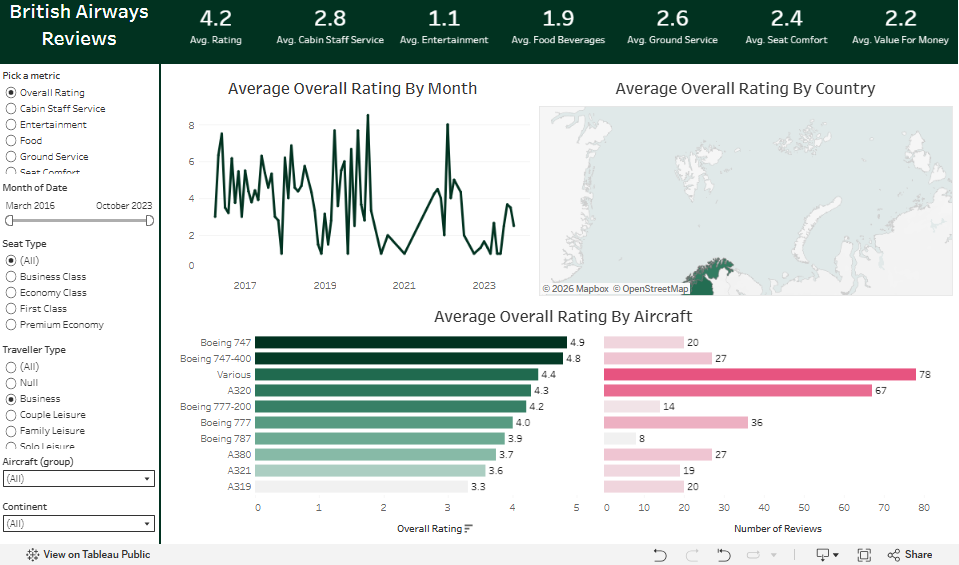
A Tableau review dashboard exploring service ratings, reviewer geography, and changes over time.
What does the overall rating leave out?
A single overall rating can hide different experiences across service categories, locations, and time. Reviews need context before they can guide an investigation.
Bring review volume, average ratings, service categories, geography, and time trends into a coherent view of customer experience.
Frame the experience
Organized the dashboard around total reviews, average customer rating, and service-category ratings to help compare dimensions of the journey.
Add geographic and temporal context
Used reviewer geography and review trends to examine where feedback originated and how activity changed over time.
Interpret the patterns
Documented observations included substantial review representation from the United Kingdom, weaker seat-comfort and food ratings, and a marked decline in review activity in 2020.
What the work delivers.
A Tableau-based customer-experience story that connects overall ratings to service categories, geographic context, and review activity.
Review volume affects interpretation. A change in the number or origin of reviews deserves attention alongside a change in average sentiment.
Project scopeThis is an independent portfolio analysis, with no affiliation to British Airways. The screenshot shows the dashboard with Business selected under traveller type; the displayed values reflect that filter.